Below is an article written by Lorimer Wilson of munKNEE.com. munKNEE.com is a new affiliate of eResearch.com.
//
There’s a simple shortcut to tracking the health of the global economy. It’s called the copper-to-gold ratio. On the surface, gold and copper prices don’t seem to bear a direct relationship to each other yet this simple ratio is one of the untold wonders of market analysis. If you want to know how the global economy is doing let this simple indicator do the talking – and here is what it is saying these days.
Written by Lorimer Wilson, editor of munKNEE.com
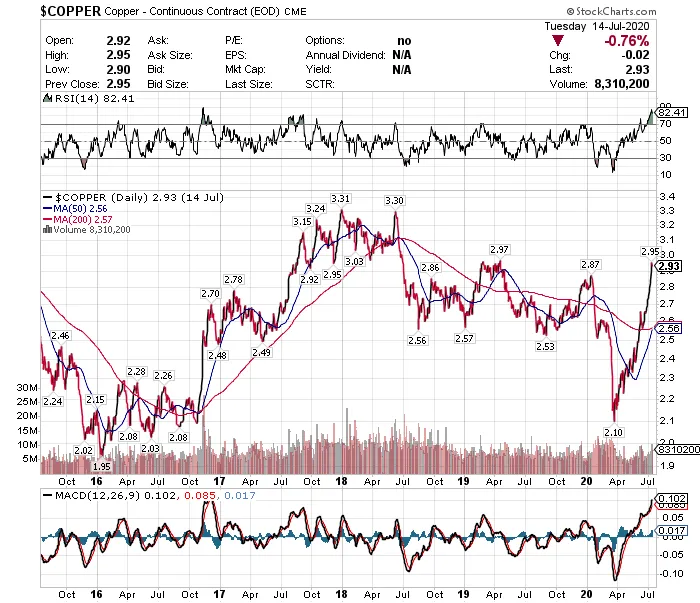
Copper is an industrial metal. Demand increases during periods when economic output is rising. Gold is a store of value with limited industrial applications. These differing uses of the metals have allowed the CGR to act as an accurate barometer of global growth.
The Copper:Gold ratio (CGR) is calculated by dividing the market price of copper by the market price of gold.
- A declining copper:gold ratio shows a weakening economy, while a rising ratio shows a strengthening economy.
- The secret to understanding this ratio is not its current value, however. What’s much more important is the directional trend of the chart.
Below are charts of the price of copper since 2015, the price of gold during that same period and their relationship as per the CGR.
COPPER
GOLD
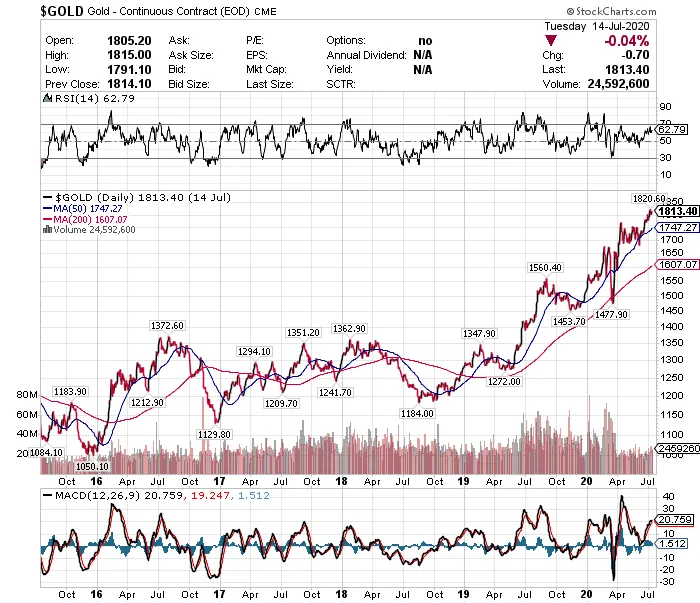
When gold prices are high it signals the economy is not healthy. Investors buy gold as protection from either an economic crisis or inflation. Low gold prices mean the economy is healthy. Investors have many other more profitable investments like stocks, bonds, or real estate.
COPPER:GOLD RATIO
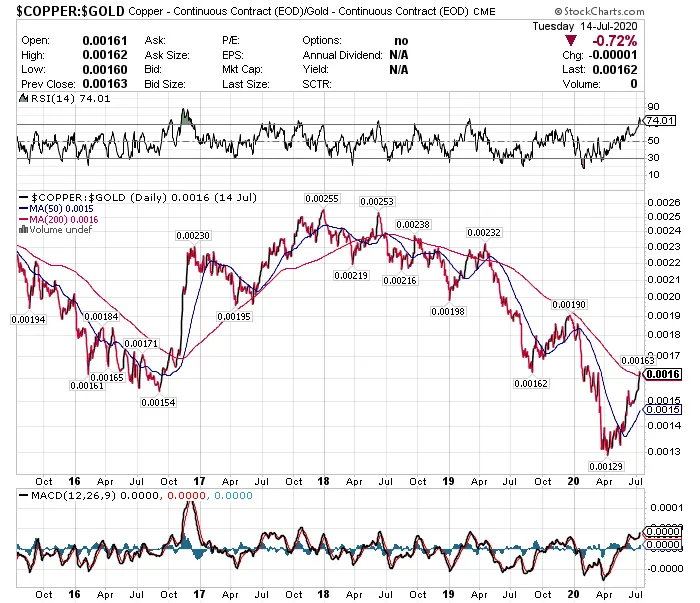
The CGR:
- was UP 64% from mid-2016 until the beginning of 2018 (economic expansion)
- but is DOWN 39% since then (economic contraction).
TNX
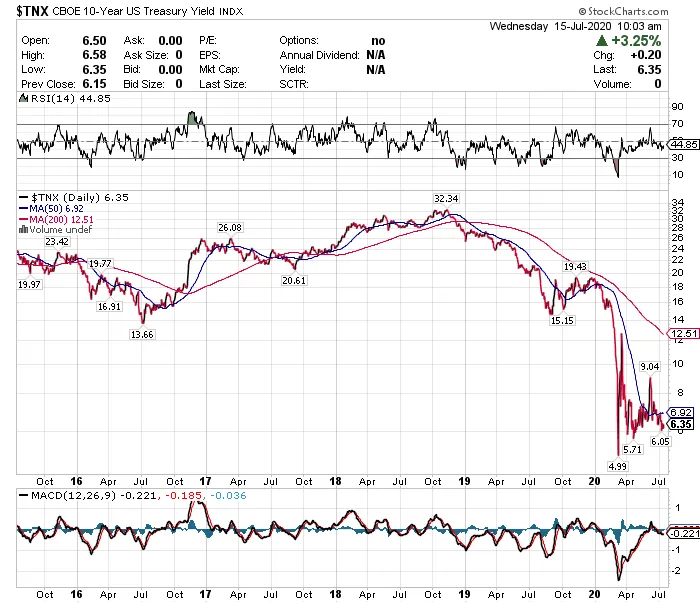
The yield on 10-year Treasury Notes (TNX) also tends to rise during economic expansion because investors’ inflation expectations are on the rise. The yield of the 10-year US Treasury bond is as follows:
The TNX:
- was UP 137% from mid-2016 until November 2018 (economic expansion)
- but is DOWN 80% since then (economic contraction).
Conclusion
There should be a positive relationship between the copper-gold price ratio and 10-year yields. Both should be rising and falling based on the state of the world economy so the recent weakness of both the CGR and the TNX suggest that economic growth is weak going forward.
//
To view the complete article and more from munKNEE.com, please visit: https://www.munknee.com/the-coppergold-ratio-is-one-of-the-untold-wonders-of-market-analysis-heres-what-its-saying/
//
munKNEE.com is a new affiliate of eResearch.com. To learn more about munKNEE.com, please visit their website and sign-up for their weekly newsletter.