eResearch | It is worth repeating/reminding that the stock market is forward-looking. A former head-of-research boss frequently said that the market “looks over the valley”. Thus, today’s market is beginning to discount the anticipated economic recovery that will ensue as the COVID-19 vaccination program reaches more and more citizens. But, eventually, that looking ahead will fully discount all or most eventualities associated with the COVID-related economic recovery, and the market will need a new catalyst or catalysts to propel it forward.
Markets also need time to digest recent gains. Thus, there is always a constant ebb and flow. This is normal, and this is healthy. Anticipating just how much the “ebb” portion is dictates decision-making in terms of pruning, or not, one’s portfolio. Here is where seasonality trends can be particularly helpful.
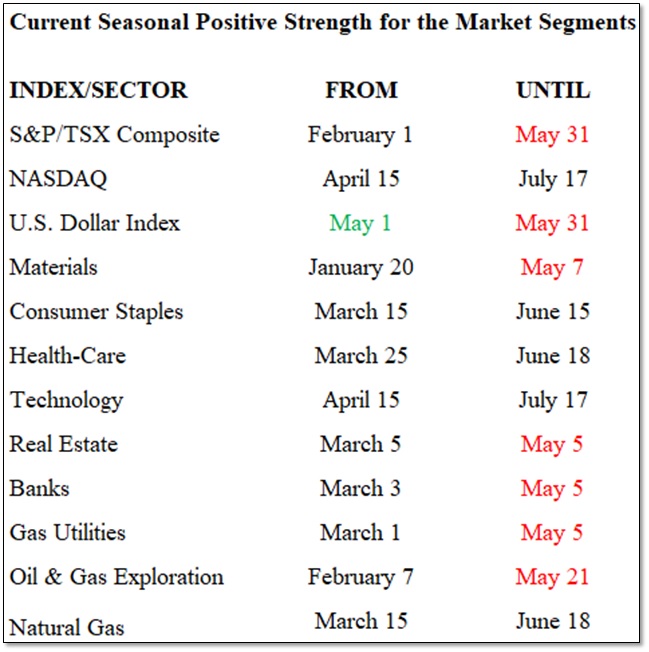
This month, there is just one new addition, the U.S. Dollar, and its life is short-lived. Its strength lasts but this one month of May. Seven indexes/sectors, including the U.S. Dollar, expire in May.
Changes for May
The market strength of May’s one addition, the U.S. Dollar, also expires at the end of May. It is joined by six other indexes/sectors: the S&P/TSX Composite Index; Materials; Real Estate; Banks; Gas Utilities; and Oil & Gas Exploration, all of which give up their expected market strength as May concludes.
Seasonal Trends for the Market Segments in May
The following table shows which indexes/sectors gain or lose seasonal strength during the month of May. There is 1 addition this month, shown in GREEN under FROM, and 7 expiries this month, shown in RED under UNTIL
NOTE: A full seasonality list of indexes and sectors is provided at the end of this report.
Importance of Seasonality Trends
Seasonality refers to particular time-frames when stocks/sectors/indexes are subjected to and influenced by recurring tendencies that produce patterns that are apparent in the investment valuation process. A seasonality study preferably uses at least 10 years of data.
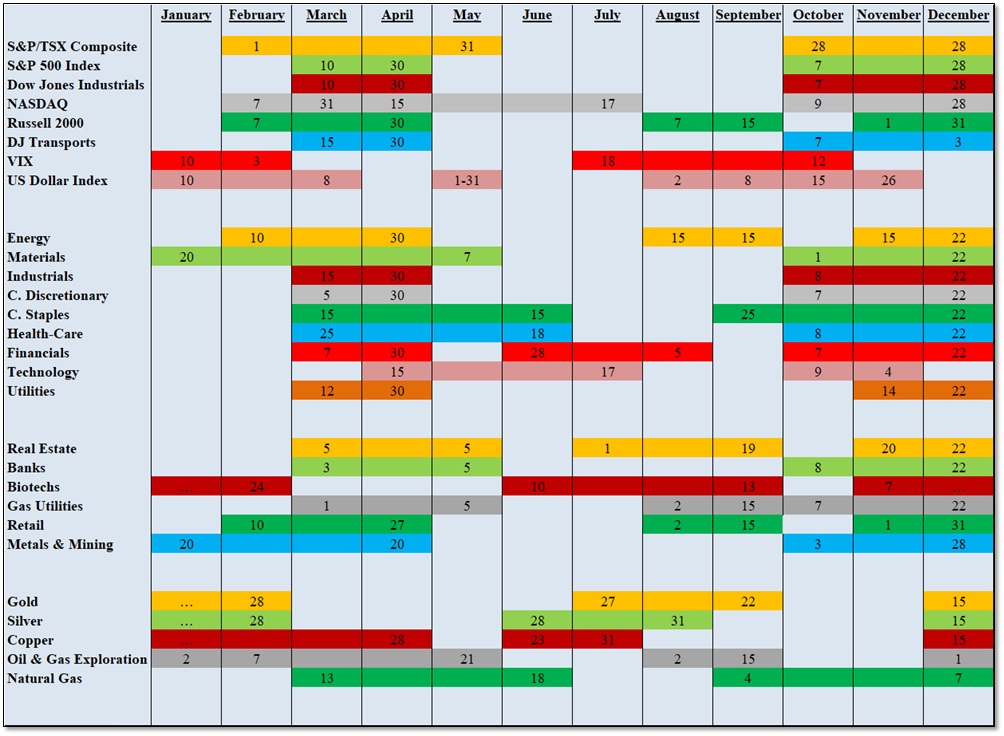
Seasonality Trends Chart
The Seasonality Trends chart below was updated in December 2020. The chart shows the periods of seasonal strength for 28 market segments (sectors/indexes). Each bar indicates a buy and a sell date based upon the optimal holding period for each market sector/index.
The Seasonality trends chart is an ever-changing 14-year average of the indexes and sub-indexes that we track. The information in the chart is courtesy of www.equityclock.com.