eResearch | The S&P 500 Index continues its inexorable climb upwards. U.S. investors have more than turkey to celebrate their Thanksgiving Day this year. In 2019 to-date, the Index is up 25.8%.
Here is the S&P 500 Index one-year chart. In these charts below, we compare and contrast the November chart with the October chart.
Chart 1A: One-Year Chart (on October 28, 2019)
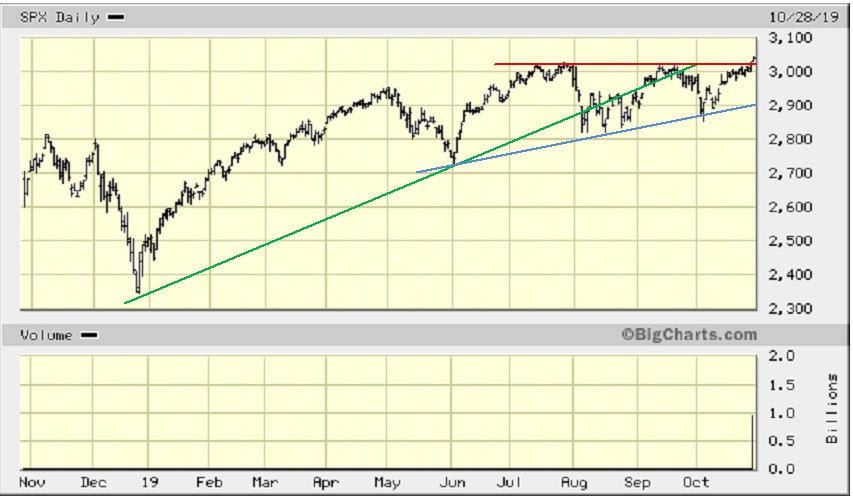
October 28 Observation: 2019’s Green up-trend line that started in late December 2018 was breached in August and is no longer a factor. The Blue up-trend line forms the bottom of an ascending triangle, which is bounded on the top by the Red resistance line that has just been broken to the upside.
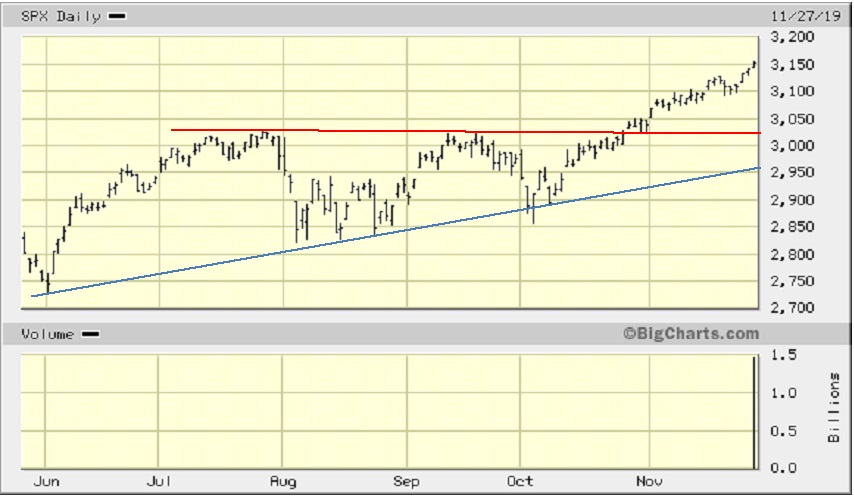
Chart 1B: One-Year Chart (on November 27, 2019)
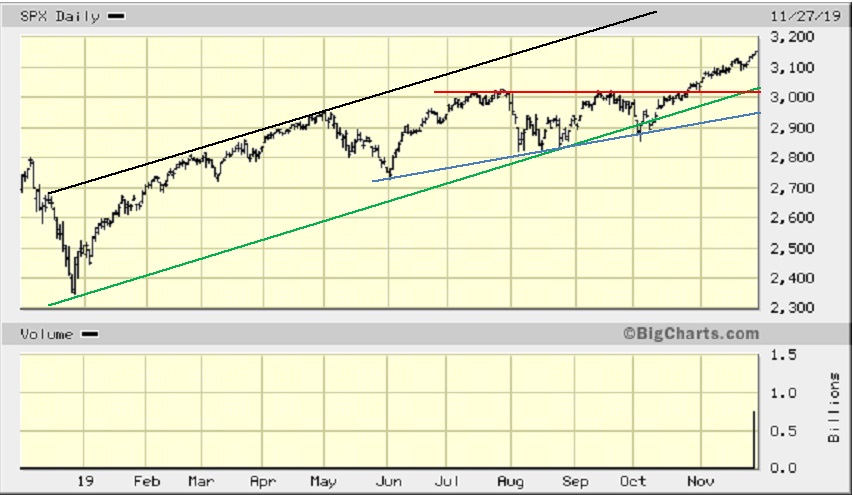
November 27 Observation: We have drawn in the same Green, Blue, and Red trend lines as provided in Chart 1A. We added a new Black trend-line that exactly parallels the Green up-trend-line and, in so doing, we have created a channel for the Index. (Apologies, we are not able to extend the chart values any higher than what is provided from the chart source.) (Also, although the eye is deceiving, the two lines are exactly parallel.) Chart 1B shows that the Index truly did break out of the ascending triangle in late October with conviction and did not even come back to test support at the Red line. This makes for a positive break-out. The Index is now about in the middle of the channel … “not too hot; not too cold”!
Chart 2 following takes a look at the Index over the last six months. First the chart from last October 28 and then the current chart as of November 27.
Chart 2A: Six-Months Chart (on October 28, 2019)
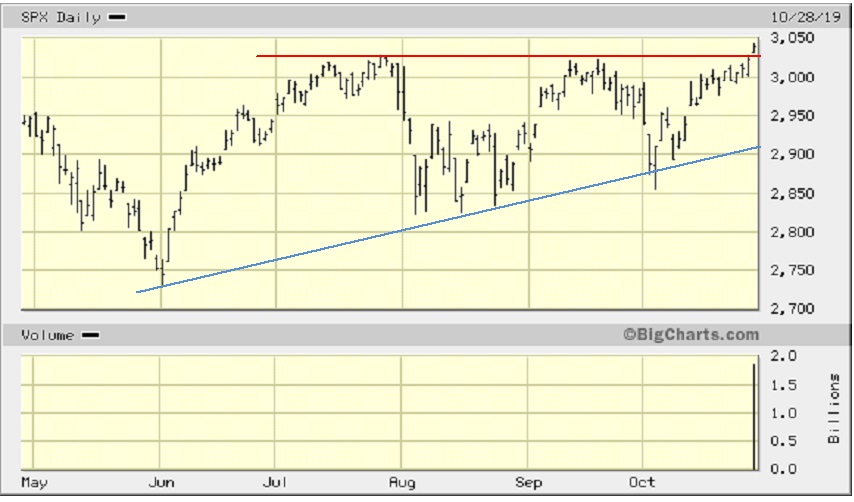
October 28 Observation: Chart 2 above clearly shows the break-out by the Index above the triangle. If it had failed, it would have completed a very bearish Triple Top. So, the break-out is technically significant.
Chart 2B: Six-Months Chart (on November 27, 2019)
November 27 Observation: Again, we have drawn the same trend-lines in Chart 2B as were shown in Chart 2A. The break-out from the ascending triangle is definitive.
Next, we look at a 3-month chart to analyze the latest up-trend.
Chart 3: Three-Months Chart (on November 27, 2019)
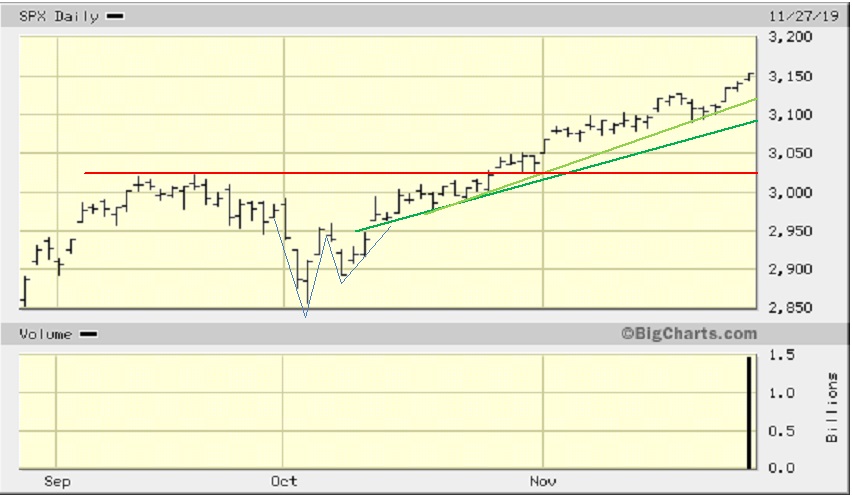
November 27 Observation: We have provided four formations in Chart 3. First is a (wobbly) “W” shown in Blue. Then there is a Green major up-trend line, and a Light Green minor up-trend line. The Index, for the moment, is comfortably above both of these up-trend lines. If the Index declines, and if it breaches the first support up-trend line, then there is a second chance for support. For consistency, we include the Red resistance-turned-support line from Chart 2. It represents a third supporting “line-in-the-sand”.
Summary
Chart 1B shows that the S&P 500 Index has definitively broken out of its ascending triangle and is sitting in the middle of its up-trend channel. Conclusion: Bullish.
Chart 2B shows the ascending triangle break-out more clearly. Conclusion: (still) Bullish.
Chart 3 shows the Index is trending well above two rising up-trend lines. Conclusion: Bullish.
Downside Support
Here is a list of possible areas of support if the Index were to sustain a notable down-turn.
Support #1: From Chart 3, at Light Green up-trend line at about 3,120 – 3,125. (-1.0%)
Support #2: From Chart 3, at Green up-trend line at about 3,090 – 3,100. (-1.9%)
Support #3: From Chart 3, at Red horizontal support line at about 3,025. (-4.1%)
Support #4: From Chart 3, at the top of the “W” formation at about 2,950 – 2,960. (-6.3%)
Support #5: From Chart 3, at the bottom of the “W” formation at about 2,850. (-9.6%)
Support #6: From Chart 2B, at the triple-bottom August lows at about 2,825. (-10.4%)
Support #7: From Chart 1B, at the June low at about 2,740. (-13.1%)
Support #8: From Chart 1B, at the December 2018 low at about 2,350. (-25.5%)
CONCLUSION
As long as the S&P 500 Index continues to trend higher, the “sky is the limit”. The first indication that the up-trend may be coming to a close is if the Index starts to “roll over”. If a rounding top occurs, then any break to the downside would call into play the various support levels outlined above unless, of course, a new technical pattern forms before the rounding top occurs. Then, it would be the first line of support, whatever it might be.
Thus, although the Index is at all-time highs, remember that “the trend is your friend” and you should go with it until it signals otherwise.
Also keep in mind that we are approaching year-end and that there is often a “Santa Claus” rally.
Money funds will also be doing a lot of window-dressing for year-end, and that typically means selling their losers and maintaining/buying their winners.
//