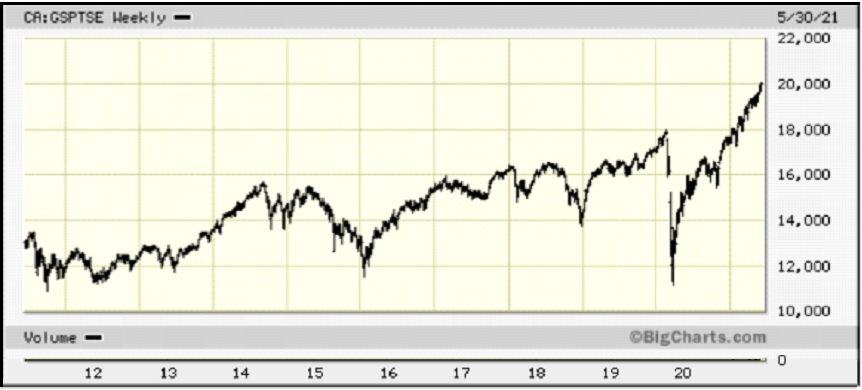
eResearch | The S&P/TSX Composite Index (“S&P/TSX” or the “Index”) has reached a milestone. For the first time ever, it has closed above 20,000! From the March 2020 low, the Index has gone almost parabolic, with just a brief pause in September – October last year. This kind of relentless upward move usually ends with a pull-back, often resulting in a significant retraction. Downside support sits at 18,000.
CHART 1: Ten-Year Chart: S&P/TSX Composite Index
The S&P/TSX closed on Friday, June 4, 2021 at 20,029.19. (Its intra-day high was 20,050.36.) To reach a close of 3% above the 20,029 reading would be 20,630. (See arrow below.)
CHART 2: One-Year Chart: S&P/TSX Composite Index
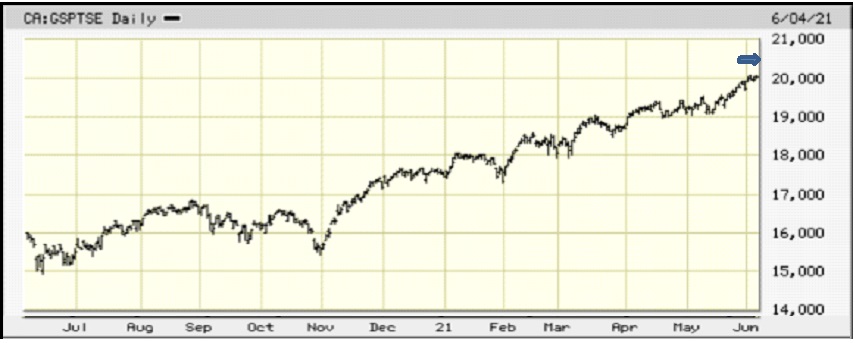
Observation: In the one-year chart shown above, the arrow denotes 20,630, which is 3% above Friday’s closing price.
Chart 3: Two-Year Chart: S&P/TSX Composite Index
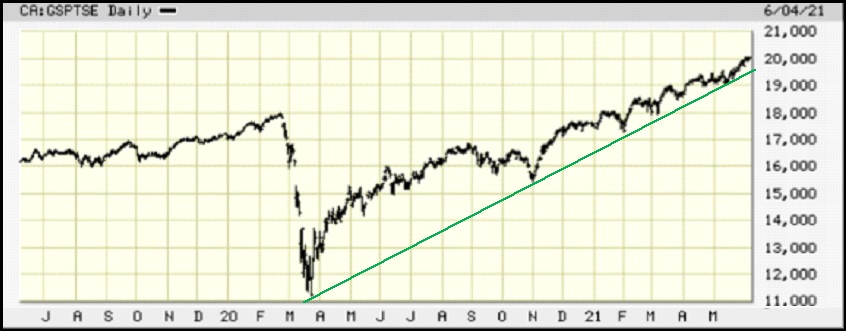
Observation: In the two-year chart shown above, the rising trend-line (Green line) that started in March 2020 at the beginning of the COVID-19 pandemic is still intact, meaning the bullish market that began a year ago March could drop about 400 points from here and still be valid. So, the Index has a useful buffer in place.
CONCLUSION: We remain cautious towards the market and recommend defensive positions. Given the recent strong upward movements in stock prices, we would welcome over the summer months a lengthy consolidation period or a meaningful, but healthy, pull-back.
Notes: All numbers in USD unless otherwise stated. The author of this report, and employees, consultants, and family of eResearch may own stock positions in companies mentioned in this article and may have been paid by a company mentioned in the article or research report. eResearch offers no representations or warranties that any of the information contained in this article is accurate or complete. Articles on eresearch.com are provided for general informational purposes only and do not constitute financial, investment, tax, legal, or accounting advice nor does it constitute an offer or solicitation to buy or sell any securities referred to. Individual circumstances and current events are critical to sound investment planning; anyone wishing to act on this information should consult with a financial advisor. The article may contain “forward-looking statements” within the meaning of applicable securities legislation. Forward-looking statements are based on the opinions and assumptions of the Company’s management as of the date made. They are inherently susceptible to uncertainty and other factors that could cause actual events/results to differ materially from these forward-looking statements. Additional risks and uncertainties, including those that the Company does not know about now or that it currently deems immaterial, may also adversely affect the Company’s business or any investment therein. Any projections given are principally intended for use as objectives and are not intended, and should not be taken, as assurances that the projected results will be obtained by the Company. The assumptions used may not prove to be accurate and a potential decline in the Company’s financial condition or results of operations may negatively impact the value of its securities. Please read eResearch’s full disclaimer.