eResearch | Investment money seems to be moving back towards “value” stocks after years of out-performance by “growth” stocks. Keith Richards of ValueTrend compares and contrasts the historic performance between the true value stocks, including the large-cap sector, and momentum stocks, which include the technology sector.
-
Value Stocks
Richards uses the iShares MSCI USA Value Factor ETF (AMEX: VLUE) as his market evidence that the Value sector is breaking out.
Chart 1: Six-Year VLUE ETF
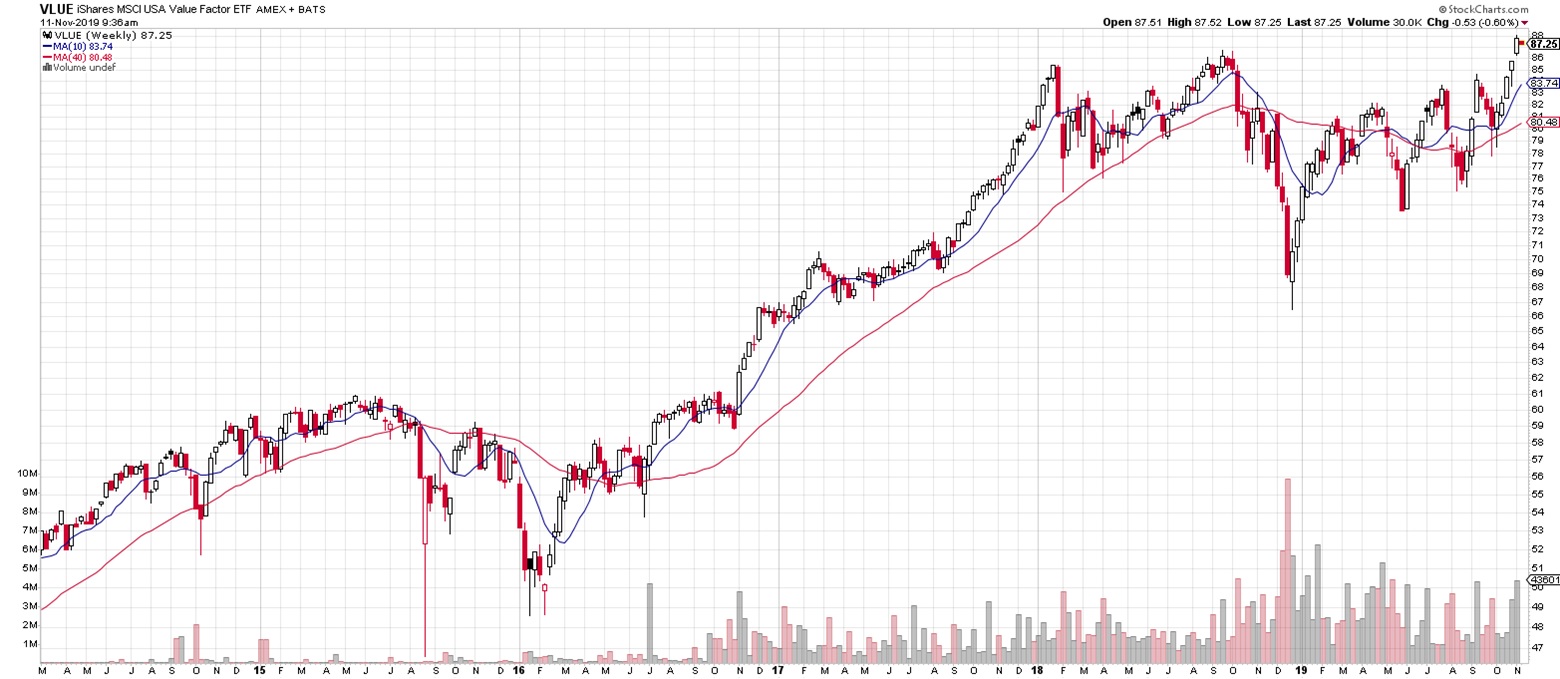
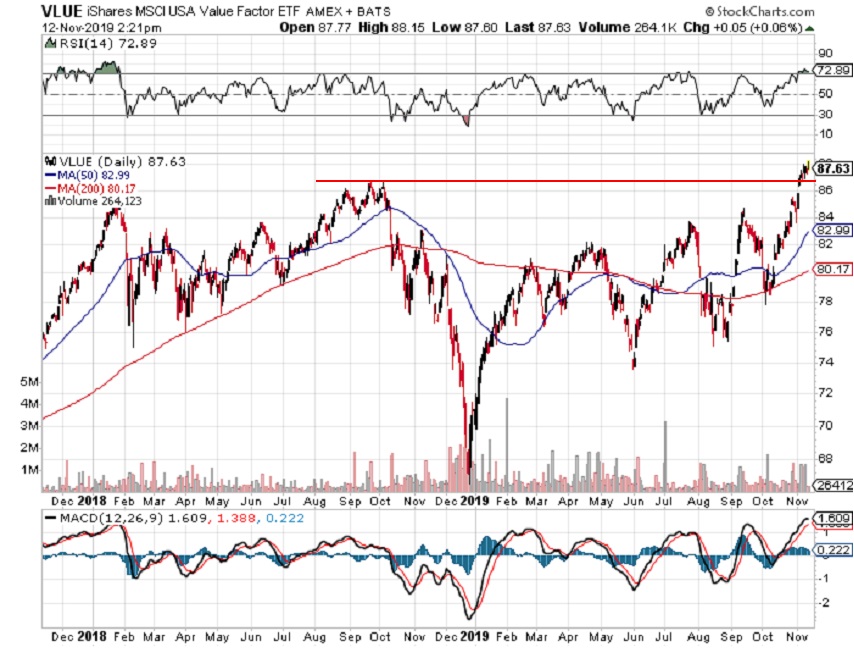
Chart 2 below, with only a two-year time frame, shows more clearly the break-out by VLUE. We have drawn in the former resistance line depicted in RED at just below $87. The VLUE ETF actually gapped higher on the break-out, a bullish technical occurrence.
Chart 2: Two-Year VLUE ETF
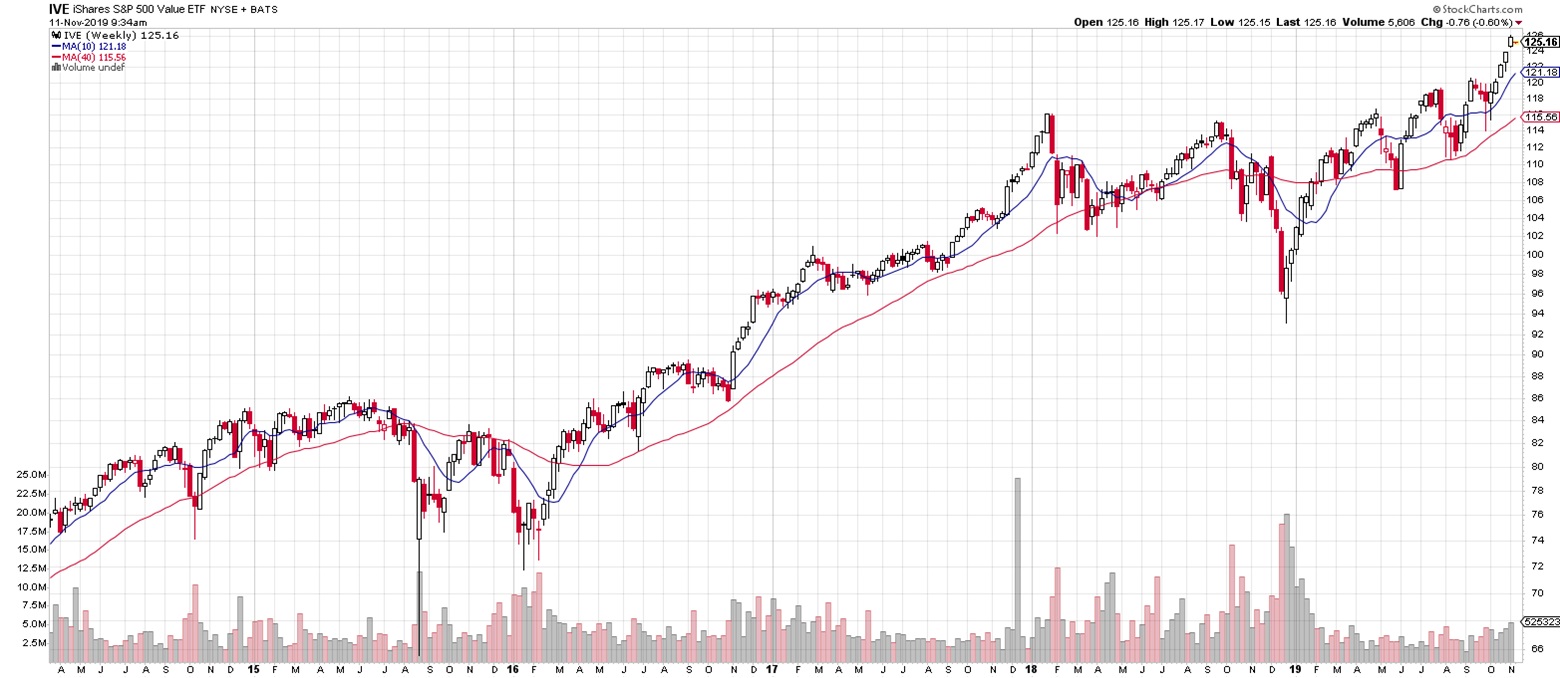
This break-out by VLUE is mirrored in the impressive performance exhibited by the S&P 500 Index. No doubt, the Value sector contributed to the general Index’s overall market gain.
Chart 3: Six-Year S&P 500 Index
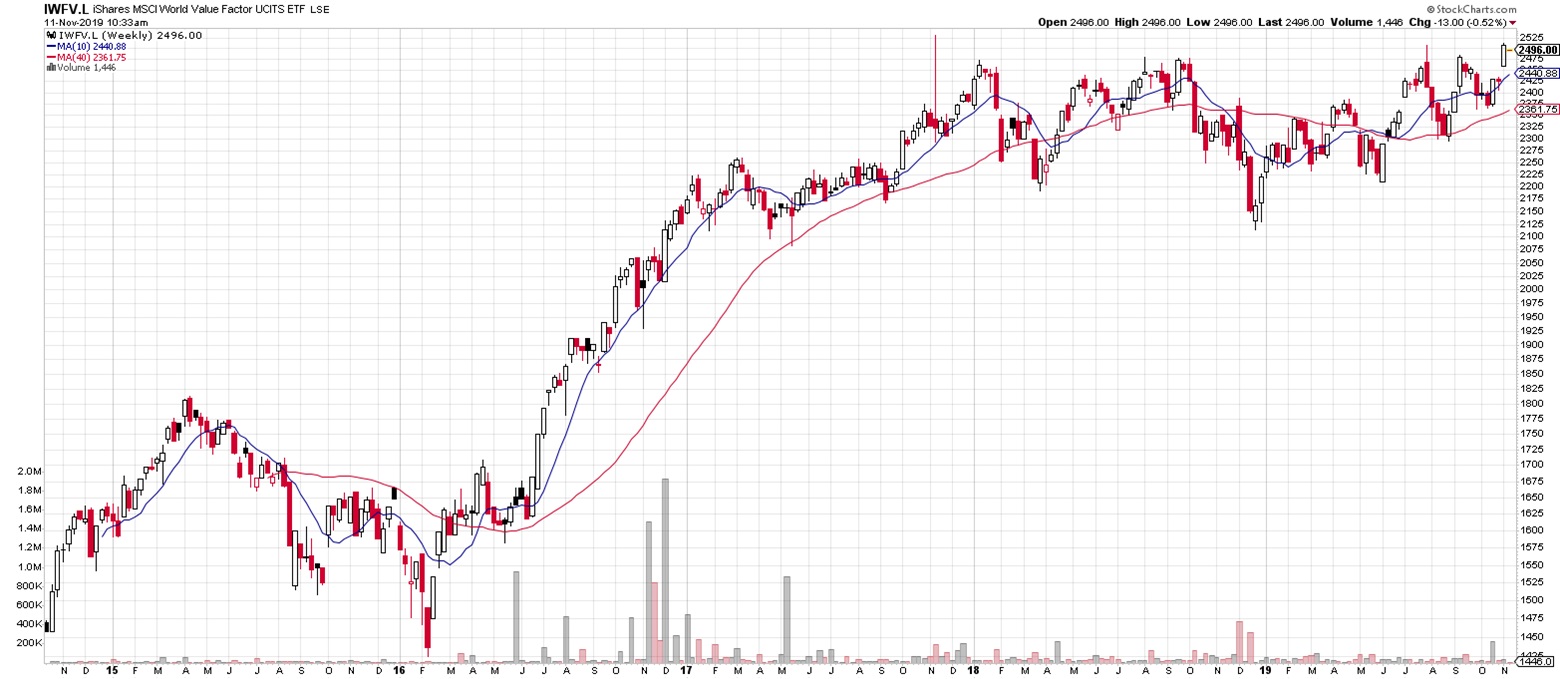
To reinforce his argument, Richards also looks at the iShares MSCI International Value ETF (LSE: IWFV) (Chart 4 below) and notes that this ETF is also breaking out. Richards uses the European-listed value ETF instead of the U.S.-listed value ETF because it strips out the benefit gained from the weaker U.S. Dollar experienced in the last few months.
Chart 4: Six-Year IWFV ETF
-
Momentum Stocks
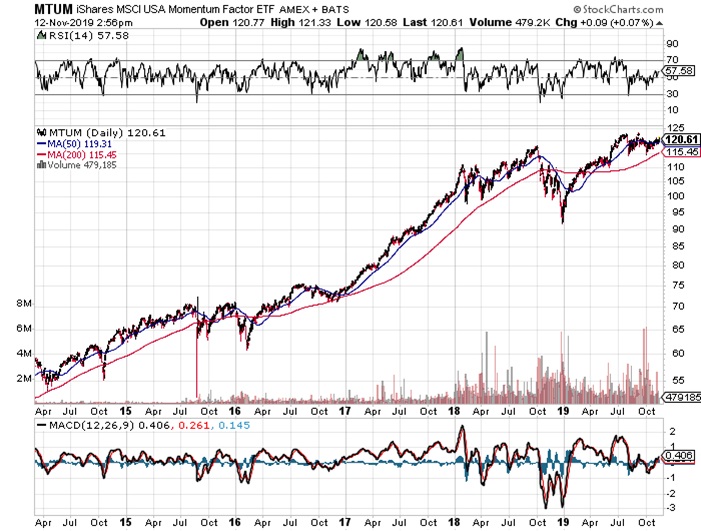
The Momentum sector comprises the large technology companies plus a few select big-ticket names. This group performed extremely well after emerging out of the 2008-2009 recession until early 2018. The group has stalled since then, as shown in Chart 5 below for the iShares US Momentum ETF (MTUM-US).
Chart 5: Six-Year MTUM ETF
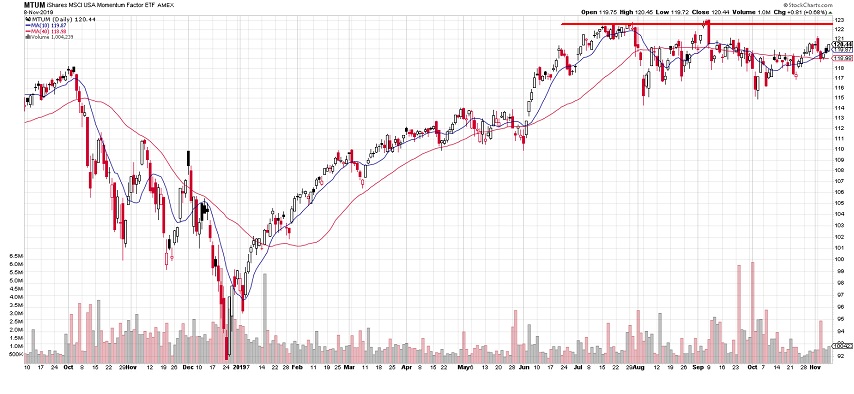
For comparative purposes with VLUE, Chart 6, next, is the two-year MTUM chart with its RED resistance line drawn in. The ETF is nowhere near breaking out at the present time.
Chart 6: Two-Year MTUM ETF
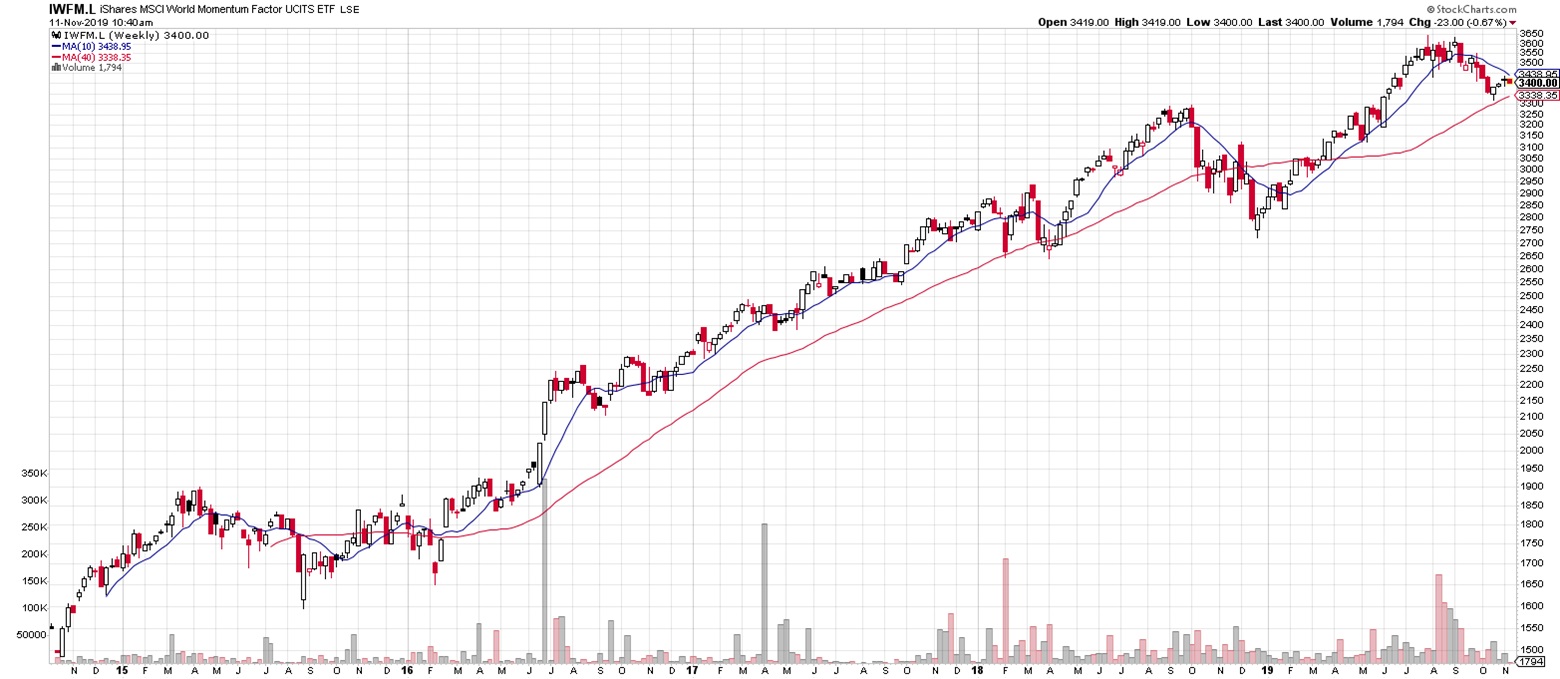
Again, for comparative purposes, Richards includes the six-year iShares MSCI International Momentum ETF (LSE: IWFM), which is also showing weakness.
Chart 7: Six-Year IWFM ETF
Conclusion
If the market is rotating into the value plays at the expense of the momentum group, Richards sums up by asking the question whether investors should be examining the stock composition of the Value sector ETFs for future investment ideas.
//