We continue to monitor four indicators to help guide us through these troubled times:
- CBOE Volatility Index (VIX)
- S&P 500 Chart of the 2008-2009 Recession with today’s S&P 500 mapped over it.
- S. Coronavirus New Cases
- S. Seasonally Adjusted Weekly Unemployment Claims
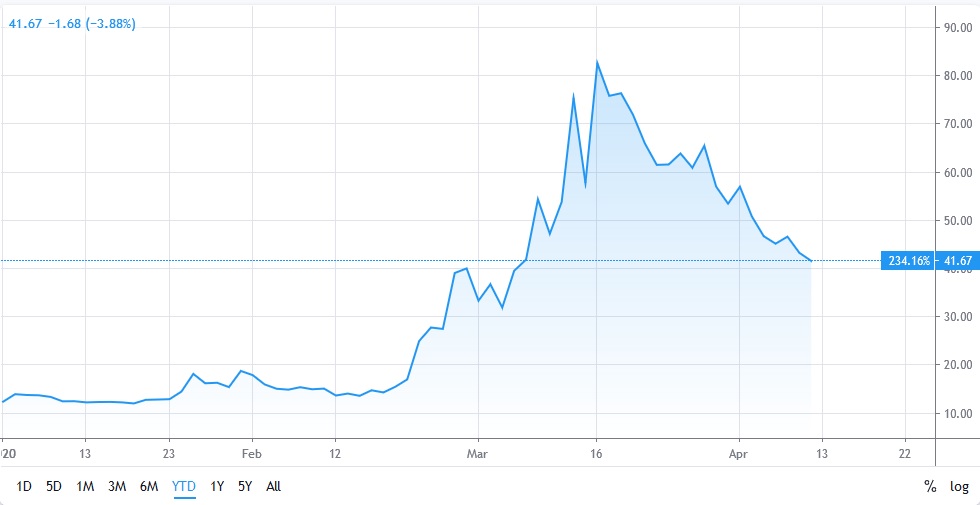
1) VIX: S&P 500 Market Volatility Index
| This week: 41.7 | Last week: 46.8 | 2 weeks ago: 65.5 |
| Remains in the “High Volatility” range. | ||
| Why it is important: The VIX index measures the market’s expectation for the 30-day forward-looking volatility and is derived from the S&P 500 index options. | ||
| Below 12: Low volatility | 12 to 20: Normal volatility | Above 20: High volatility |
CHART 1: VIX Index Chart – Year-to-Date – Currently 41.7 Down Slightly from 46.8 Last Week
2) S&P 500 Chart
The US indices had their best week in 45 years but the concern is that the stock market recovery is not going to be “V” shaped but more likely a “W” shaped recovery.
The U.S. government has passed 3 bills of legislation to pump over US$2 trillion of funds into households and business. In addition, last week, the U.S. Federal Reserve announced over US$2.3 trillion of new programs to support the “Main Street” lending initiative, loans to states and municipalities, and buying “riskier” assets. These new programs are in addition to other U.S. Federal Reserve measures launched in early March that supplied more than US$1 trillion to add liquidity to the markets by purchasing U.S. Treasury and mortgage-backed securities.
All of this liquidity might be causing the recent rebound in the North American stock markets.
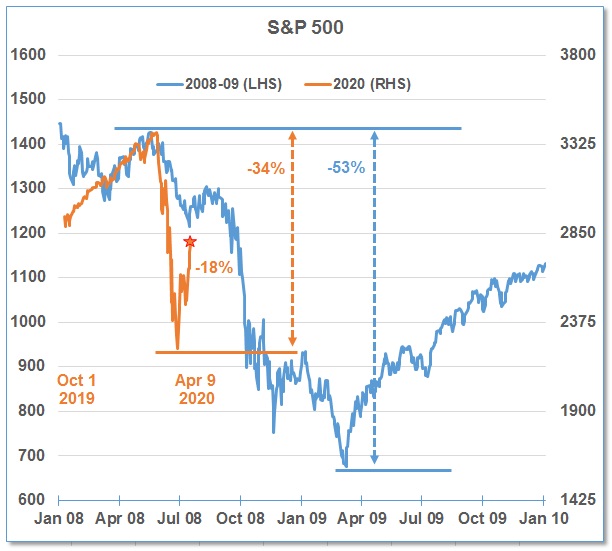
In the chart below, we have overlaid the stock market since October 2019 on top of the stock market during 2008-09 during the financial crisis.
- The S&P 500 closed the holiday-shortened week (April 9) at 2789.82, down 18% from the high of 3386.15 on February 19, 2020.
- At the recent bottom, the S&P 500 was down almost 34% from its peak in February.
- During the 2008-09 Financial Crisis recession, the S&P 500 dropped 53%.
- In the current market, the S&P 500 dropped further faster but that does not mean we will have a faster recovery.
CHART 2: Current S&P 500 Index Mapped Over the Chart of the S&P 500 from 2008-2009
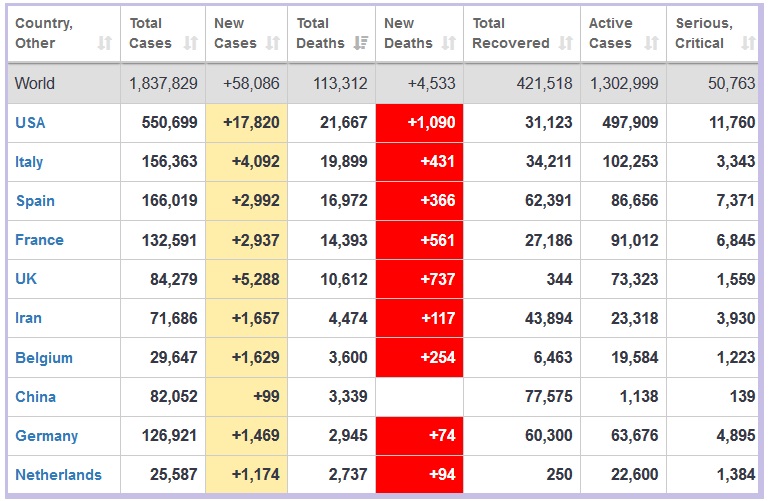
3) U.S. Coronavirus New Cases and World-wide Coronavirus Stats
The number of daily new cases in the United States peaked around April 3 at over 34,000 cases reported per day and, on April 11, approximately 30,000 new cases were reported.
However, the U.S. is now the country with the highest number of coronavirus-related deaths, recording 21,667 as of April 12, surpassing that of Italy (19,899) and Spain (16,972).
With 90% of Americans under some sort of stay-at-home order, the negative economic impact will continue, however the U.S. stock markets had their best week in 45 years so we’ll have to see if this market enthusiasm can be sustained.
CHART 3: Daily New Cases of COVID-19 in the United States
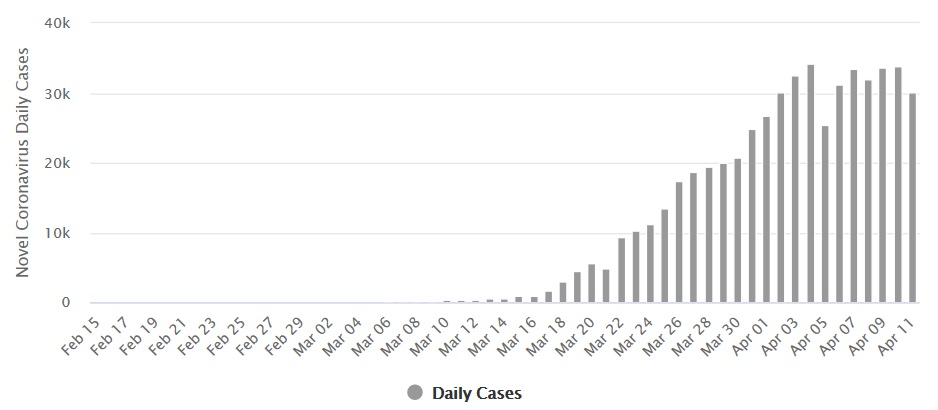
CHART 4: COVID-19 World Stats
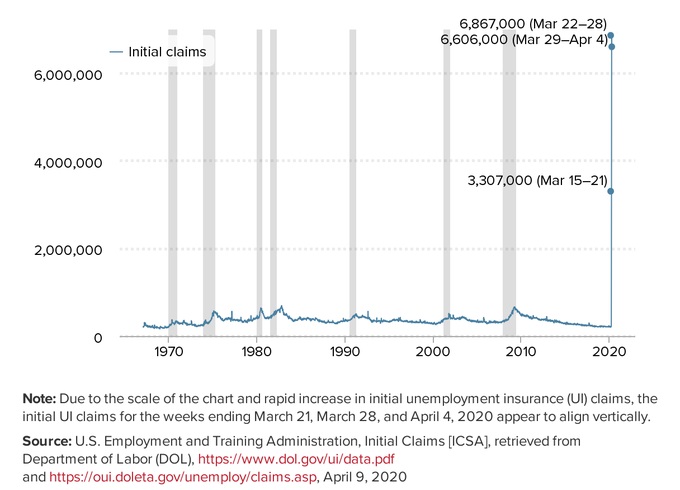
4) U.S. Seasonally Adjusted Weekly Unemployment Claims
Last week, 6,606,000 Americans applied for unemployment benefits as the widespread layoffs caused by the COVID-19 pandemic crisis continue.
This amount is slightly lower than 6,867,000, from the previous week, which marked the highest level of Unemployment Claims in the history of Unemployment Claims.
The three-week total is now at 16.78 million. The continued surge in new unemployment claims was not a surprise as stay-at-home measures continued to expand across the United States. As previously noted, some economists expect 15-25 million Americans will likely be laid off or furloughed before the economy recovers from the coronavirus impact.
CHART 5: U.S. Seasonally Adjusted Weekly Unemployment Claims
//